Monitoring and Logging in AWS
Overview
Securityis job number 1️⃣, andeverythingfails all the time - Werner Vogels, Amazon CTO
These are just a few of the many reasons that we need Observability and Monitoring.
The 3 pillars 🏛️ of observability in AWS:
CloudWatch
- Metrics: Metrics are a numeric representation of data measured over time or time series data.
- Logs: Immutable, timestamped records of discrete events that happen over time.
- Events: Send notifications when certain events happen in your AWS
- Alarms: React in real-time to metrics/events
X-Ray
- X-ray traces represent a series of related distributed events that encode the end-to-end request flow through a distributed system.
- They provide visibility, such as latency, into the path traversed by a request and the structure of the request.
CloudTrail
- Internal monitoring of API calls being made
- Audit changes to AWS Resources by your users
Overall all together these 3 technologies give you a solid foundation to observability in AWS.
CloudWatch
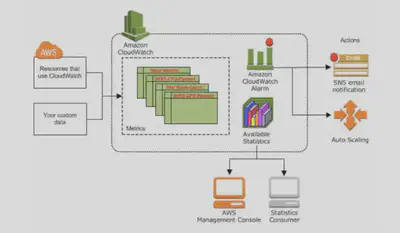
Amazon CloudWatch is Amazon’s main observability service. With a log server, metrics server, dashboards, and alarms, it provides a wide range of observability features.
CloudWatch is basically a metrics repository. Any AWS service, such as EC2 puts metrics on the repository and you retrieve statistics based on those metrics. If you put your own metrics into CloudWatch, you can retrieve statistics on those as well.
CloudWatch does not aggregate data across regions. Therefore metrics are completely separate across regions.
CloudWatch Concepts:
- Metrics:
- Represents a time-ordered set of data points that are published to CloudWatch.
- It is the variable to monitor (CPUUtilization, NetworkIn…)
- Metrics cannot be deleted but they will automatically expire after 15 months if no new data is published to them. As new data comes in, data older than 15 months are dropped.
- Metrics are uniquely defined by:
Metrics, and their identifiers, can be listed using the AWS CLI tool and the AWS console.
  $ aws cloudwatch list-metrics --namespace AWS/EC2
  {
      "Metrics": [
          {
              "Namespace": "AWS/EC2",
              "MetricName": "NetworkPacketsIn",
              "Dimensions": [
                  {
                      "Name": "InstanceId",
                      "Value": "i-08d99a369f572dbdb"
                  }
              ]
          },
  ...
Namespace : AWS namespaces typically use the naming convention
AWS/service. For example, AWS Lambda uses theAWS/Lambdanamespace. Metrics in different namespaces are isolated from each other.

Name : Name of the Metric. e.g. mem_used_percent
Dimensions : A dimension is a K-V pair that is part of the identity of a metric. You can assign up to 30 dimensions to a metric. Each metric has specific characteristics that describe it. You can think of dimensions as categories for those characteristics.

Statistics: Metric data aggregations over a specified period of time.
For example we can calculate an average across all Data Points in five minute periods over the course of an hour for a
CPU utilizationPer-Instance Metric using the AWS CLI tool.$ aws cloudwatch get-metric-statistics \ --namespace AWS/EC2 \ --metric-name CPUUtilization \ --dimensions Name=InstanceId,Value=i-08d99a369f572dbdb \ --start-time 2020-08-11T16:00:00Z \ --end-time 2020-08-11T17:00:00Z \ --period 300 \ --statistics Average { "Label": "CPUUtilization", "Datapoints": [ { "Timestamp": "2020-08-11T16:30:00+00:00", "Average": 0.0666666666666676, "Unit": "Percent" }, ...We get the same data using the Amazon CloudWatch service in the AWS Console:

Custom Metrics:
- You can define and send your own custom metrics to CloudWatch
- Ability to use dimensions (attributes) to segment metrics like Instance.id, Environment.Name
- Metric resolution (StorageResolution API parameter – two possible value):
- Standard: 1 minute (60 seconds)
- High Resolution: 1 second – Higher cost
- Use API call PutMetricData
- Use exponential back off in case of throttle errors
Monitoring metrics with multiple dimensions in CloudWatch is a powerful way to gain deeper insights into the performance of your resources. For example, you could monitor the CPU utilization of your EC2 instances, broken down by instance type and availability zone. This would allow you to see which instance types and availability zones are experiencing the highest CPU utilization, and take action to address any issues.
To monitor metrics with multiple dimensions in CloudWatch, you can use the put-metric-data command in the AWS CLI. This command allows you to specify the dimensions for your metric, as well as the value and the unit of measurement. Here is an example of how you could use the put-metric-data command to monitor the CPU utilization of your EC2 instances, broken down by instance type and availability zone:
aws cloudwatch put-metric-data \
    --metric-name CPUUtilization \
    --namespace EC2 \
    --dimensions InstanceType=t2.micro,AvailabilityZone=us-east-1a \
    --value 70 \
    --unit Percent
AWS CloudWatch EC2 Detailed monitoring:
- EC2 instance metrics have metrics “every 5 minutes” by default
- With detailed monitoring (for a cost), you get data “every 1 minute”
- Use detailed monitoring if you want to more prompt scale your ASG!
- The AWS Free Tier allows us to have 10 detailed monitoring metrics
- Note: EC2 Memory usage is by default not pushed (must be pushed from inside the instance as a custom metric)
Alarms: Watches a specific metric over a specified time period and performs a set of specified actions based on the value of the metric relative to a threshold.
Alarms can go to Auto Scaling, EC2 Actions, SNS notifications
Various options (sampling, %, max, min, etc…)
Alarm States:
- OK
- INSUFFICIENT_DATA
- ALARM
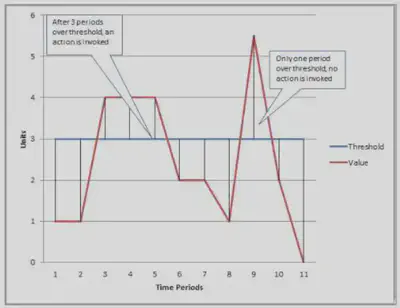
When you create an ALARM you specify 3 settings:
- Period: Length of time in seconds to evaluate the metric
- Evaluation Period: It’s the number of most recent periods or data points to evaluate when determining ALARM state.
- Datapoints to ALARM: It’s the number of data points within the Evaluation Period that must be breaching to cause the ALARM to trigger.
- High resolution custom metrics: can only choose 10 sec or 30 sec
CloudWatch Logs:
Applications can send logs to CloudWatch using the SDK
CloudWatch can collect log from:
- Elastic Beanstalk: collection of logs from application
- ECS: collection from containers
- AWS Lambda: collection from function logs
- VPC Flow Logs: VPC specific logs
- API Gateway
- CloudTrail based on filter
- CloudWatch log agents: for example on EC2 machines
- Route53: Log DNS queries
CloudWatch Logs can go to:
- Batch exporter to S3 for archival
- Stream to ElasticSearch cluster for further analytics
- CloudWatch Logs can use filter expressions
Logs storage architecture:
- Log groups: arbitrary name, usually representing an application
- Log stream: instances within application / log files / containers
Can define log expiration policies (never expire, 30 days, etc..)
Using the AWS CLI we can tail CloudWatch logs
To send logs to CloudWatch, make sure IAM permissions are correct!
Security: encryption of logs using KMS at the Group Level
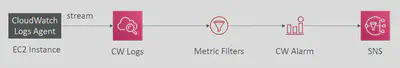
CloudWatch Logs for EC2
- By default, no logs from your EC2 machine will go to CloudWatch
- You need to run a CloudWatch agent on EC2 to push the log files you want
- Make sure IAM permissions are correct
- The CloudWatch log agent can be setup on-premises too
CloudWatch agent can collect log files specified as an individual file or a group of files. It sends them to a log stream that uses the instance ID as the default name. The log stream is in a log group that you configure.

For Amazon Elastic Container Service (Amazon ECS), deploy the CloudWatch agent as a daemon task. For Amazon Elastic Kubernetes Service (Amazon EKS) or Kubernetes, deploy the agent as a daemon set. For Amazon ECS on AWS Fargate deployment types, deploy the agent as a sidecar.

CloudWatch Logs Agent & Unified Agent
For virtual servers (EC2 instances, on-premise servers…)
CloudWatch Logs Agent
- Old version of the agent
- Can only send logs CloudWatch Logs
CloudWatch Unified Agent
- Collect additional system-level metrics such as RAM, processes, etc… and send to CloudWatch
- Collect logs to send to CloudWatch Logs
- Centralized configuration using SSM Parameter
- More details here: Install-CloudWatch-Agent
CloudWatch Logs - Encryption
You can encrypt CloudWatch logs with KMS keys
Encryption is enabled at the log group level, by associating a CMK with a log group, either when you create the log group or after it exists.
You cannot associate a CMK with a log group using the CloudWatch console.
You must use the CloudWatch Logs API:
- associate-kms-key : if the log group already exists
- create-log-group: if the log group doesn’t exist yet
In addition the key policy needs to permit CloudWatch service to interact with KMS. The default key policy needs to be edited like so in order to do that:
{
  "Version" : "2012-10-17",
  "Id" : "key-default-1",
  "Statement" : [ {
      "Sid" : "Enable IAM User Permissions",
      "Effect" : "Allow",
      "Principal" : {
        "AWS" : "arn:aws:iam::Your_account_ID:root"
      },
      "Action" : "kms:*",
      "Resource" : "*"
    },
    {
      "Effect": "Allow",
      "Principal": { "Service": "logs.[REGION].amazonaws.com" },
      "Action": [
        "kms:Encrypt*",
        "kms:Decrypt*",
        "kms:ReEncrypt*",
        "kms:GenerateDataKey*",
        "kms:Describe*"
      ],
      "Resource": "*"
    }
  ]
}
Also see CLI example here: aws-cloudwatch-cli
Metric Filter:
CloudWatch Logs can use filter
- For example, find a specific IP inside of a log
- Or count occurrences of “ERROR” in your logs
Metric filters can be used to trigger alarms
Filters do not retroactively filter data. Filters only publish the metric data points for events that happen after the filter was created.
CloudWatch Events:
Schedule: Cron jobs
Event Pattern: Event rules to react to a service doing something
- Ex: CodePipeline state changes!
Triggers to Lambda functions, SQS/SNS/Kinesis Messages
CloudWatch Event creates a small JSON document to give information about the change
EventBridge:
- EventBridge is the next evolution of CloudWatch Events
- Default event bus: generated by AWS services (CloudWatch Events)
- Partner event bus: receive events from SaaS service or applications (Zendesk, DataDog, Segment, Auth0…)
- Custom Event buses: for your own applications
- Event buses can be accessed by other AWS accounts
- Rules: how to process the events (similar to CloudWatch Events)
Dashboards:
- CloudWatch dashboards are customizable home pages in the CloudWatch console that you can use to monitor resources in a single view, even those resources that are spread across different Regions.
- You can use CloudWatch dashboards to create customized views of the metrics and alarms for your AWS resources.
X-Ray
AWS X-Ray is a service that collects data about your requests that your application serves and it provides you with tools you can use to view filter and gain insights into that data to identify issues and opportunities for optimization. For any traced request to your application, you can see detailed information not only about the request and response, but also about calls that your application makes to downstream AWS resources, microservices, databases and HTTP Web APIs.
Traces path and timing of an invocation to locate bottlenecks and failures
- Use for performance tuning
- Identify call flow of Lambda functions and API calls
- You can run X-Ray out of the box, and it will give you a high level view of your functions, but you can also instrument your code to trace individual API calls.

X-Ray Concepts
X-Ray Leverages Tracing:
Tracing is an end to end way to following a “request”
Each component dealing with the request adds its own Trace
Tracing is made of Segments. Each application/service will send them. (+ sub segments)
You can add Subsegments if you need more details in your segment
Annotations can be added to traces to provide extra-information. They are Key Value pairs used to index traces and use with filters.
Metadata: Key Value pairs, not indexed, not used for searching
X-Ray service collects data from all the different services
Service map is computed from all the segments and traces
X-Ray is graphical, so even non technical people can help troubleshoot
Ability to trace:
- Every request
- Sample request (as a % for example or a rate per minute)
X-Ray Security:
- IAM for authorization
- KMS for encryption at rest
X-Ray - How to enable it?
Your code (Java, Python, Go, Node.js, .NET) must import the AWS X-Ray SDK
Very little code modification needed
The application SDK will then capture:
- Calls to AWS services
- HTTP / HTTPS requests
- Database Calls (MySQL, PostgreSQL, DynamoDB)
- Queue calls (SQS)
Install the X-Ray daemon or enable X-Ray AWS Integration
- X-Ray daemon works as a low level UDP packet interceptor (Linux / Windows / Mac…)
- AWS Lambda / other AWS services already run the X-Ray daemon for you
- Each application must have the IAM rights to write data to X-Ray
If X-Ray is not working on EC2
- Ensure the EC2 IAM Role has the proper permissions
- Ensure the EC2 instance is running the X-Ray Daemon
To enable on AWS Lambda:
- Ensure it has an IAM execution role with proper policy (AWSX-RayWriteOnlyAccess)
- Ensure that X-Ray is imported in the code
X-Ray Sampling Rules:
- With sampling rules, you control the amount of data that you record
- You can modify sampling rules without changing your code
- By default, the X-Ray SDK records the first request each second, and five percent of any additional requests.
- One request per second is the reservoir, which ensures that at least one trace is recorded each second as long the service is serving requests.
- Five percent is the rate at which additional requests beyond the reservoir size are sampled.
The X-Ray SDK provides:
- Interceptors to add to your code to trace incoming HTTP requests.
- Client handlers to instrument AWS SDK clients that your application uses to call other AWS services.
- An HTTP client to instrument calls to other internal and external HTTP webservices.

X-Ray APIs:
X-Ray Write APIs
PutTraceSegments: Uploads segment documents to AWS X-Ray
PutTelemetryRecords: Used by the AWS X-Ray daemon to upload telemetry.
- SegmentsReceivedCount,
- SegmentsRejectedCounts,
- BackendConnectionErrors…
GetSamplingRules: Retrieve all sampling rules (to know what/when to send)
GetSamplingTargets & GetSamplingStatisticSummaries: advanced
The X-Ray daemon needs to have an IAM policy authorizing the correct API calls to function correctly
{
    "Version": "2012-10-17",
    "Statement": [
        {
            "Effect": "Allow",
            "Action": [
                "xray:PutTraceSegments",
                "xray:PutTelemetryRecords",
                "xray:GetSamplingRules",
                "xray:GetSamplingTargets",
                "xray:GetSamplingStatisticSummaries"
            ],
            "Resource": [
                "*"
            ]
        }
    ]
}
X-Ray Read APIs
- GetServiceGraph: main graph
- BatchGetTraces: Retrieves a list of traces specified by ID. Each trace is a collection of segment documents that originates from a single request.
- GetTraceSummaries: Retrieves IDs and annotations for traces available for a specified time frame using an optional filter. To get the full traces, pass the trace IDs to BatchGetTraces.
- GetTraceGraph: Retrieves a service graph for one or more specific trace IDs.
{
    "Version": "2012-10-17",
    "Statement": [
        {
            "Effect": "Allow",
            "Action": [
                "xray:GetSamplingRules",
                "xray:GetSamplingTargets",
                "xray:GetSamplingStatisticSummaries",
                "xray:BatchGetTraces",
                "xray:GetServiceGraph",
                "xray:GetTraceGraph",
                "xray:GetTraceSummaries",
                "xray:GetGroups",
                "xray:GetGroup",
                "xray:ListTagsForResource",
                "xray:GetTimeSeriesServiceStatistics",
                "xray:GetInsightSummaries",
                "xray:GetInsight",
                "xray:GetInsightEvents",
                "xray:GetInsightImpactGraph"
            ],
            "Resource": [
                "*"
            ]
        }
    ]
}
X-Ray integrates with the following AWS services:
- Elastic Load Balancer
- EC2 instances
- Lambda
- API gateway
- Elastic Beanstalk
CloudTrail
- Provides governance, compliance and audit for your AWS Account
- CloudTrail is enabled by default!
- Get an history of events / API calls made within your AWS Account by:
- Console
- SDK
- CLI
- AWS Services
- Can put logs from CloudTrail into CloudWatch Logs
- If a resource is deleted in AWS, look👀 into CloudTrail first!
- CloudWatch Metrics over time for monitoring
- CloudWatch Logs for storing application log
- CloudWatch Alarms to send notifications in case of unexpected metrics
- Automated Trace Analysis & Central Service Map Visualization
- Latency, Errors and Fault analysis
- Request tracking across distributed systems
- Audit API calls made by users / services / AWS console
- Useful to detect unauthorized calls or root cause of changes